Why are we still talking about conversion rates?
Succeeding online as an e-commerce store requires keeping a strict track of your performance metrics at all times including conversion rates. This not only helps you evaluate your current performance but also helps you identify the levers you need to push for further growth.
Every year, cost per clicks go up on Google. If conversion rates do not follow up the same way, return on ad spend and cost per acquisition goes south.
When we are optimising conversion rates, there can be thousands of metrics you can monitor, and narrowing down on the ones that drive conversions can be overwhelming – especially if you’re just starting out with this approach.
With that being said, here are some key metrics that are being neglected that will give you a good idea on how you’re doing with the conversions on your e-commerce site.
1. Conversion Rate: Using Qualitative Metrics over Quantitative Metrics
Qualitative metrics include taking a qualitative approach towards the Conversion Rate Analysis part of your website and zooming in on smaller, qualitative aspects of the funnel. This metric does not involve a very technical approach. Essentially, these are a couple of questions you could ask to conduct a thorough qualitative analysis of your website. Here are some you could use:
- Why did the customers engage with your website? Why did they originally decide to visit your site or navigate to a specific product page?
- What do they think sets you apart from other online stores? Is there a feature or service offered by your company that makes buying from you a better experience?
- What words do they use to describe your products, services, and the pages they land on? How would customers describe your business to friends or family?
Most of the “why” answers can be derived quantitatively by what looking at what channel and content they initially interacted with and what keywords they searched on. Even the figuring out how people look around on the site, there’s tool for, like Hotjar.
As a result, most data related to user behaviour already exists quantitatively and big qualitative studies become redundant or at least reduced significantly in size.



2. Conversion Rate: Not focusing on improving micro conversions
E-commerce companies are often good at tracking revenue and transaction in web analytics tools like Google Analytics. As a result, all marketing efforts are typically going into buying the traffic that will give the highest e-commerce sales conversion rates. Little focus is going into
- The steps involved in the checkout process
- Tracking and analysis of user traffic that are interested in initial interaction, not purchase.
After working with loads of different Google Analytics accounts, it’s unfortunately more so the case that we have to set up micro conversions from scratch instead of analysing and improving performance.
Here are some specific micro-conversion steps you should be tracking:
- Downloading a file linked to the product
- Opting in for email offers or subscribing to the newsletter
- Using a search filter to look for specific products
- Engaging in social actions (liking or sharing the product on social media).
3. Conversion Rate: Not Analysing Checkout and Shopping Cart Abandonment Rate
As mentioned earlier, tracking individual steps in the checkout process are often forgotten. As a result, there’s no data on what steps and reasons that are causing problems with conversion rates.
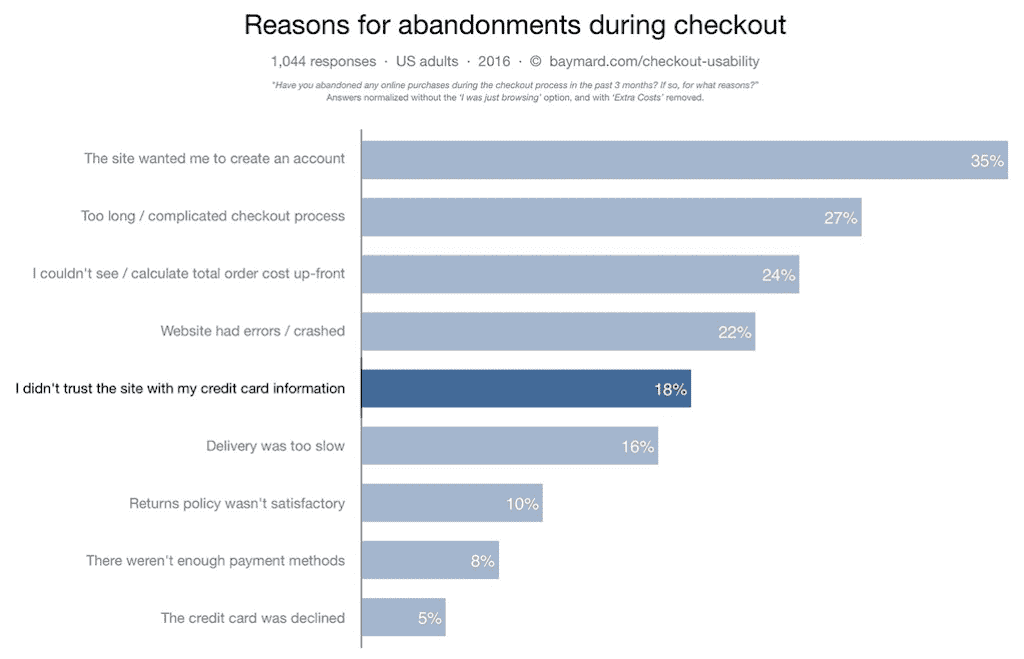
Still today, the main reason why users are dropping out is if the process is too long or complicated or if the website demands setting up an account. Addressing these issues in the checkout process is key for strong e-commerce conversion rates.
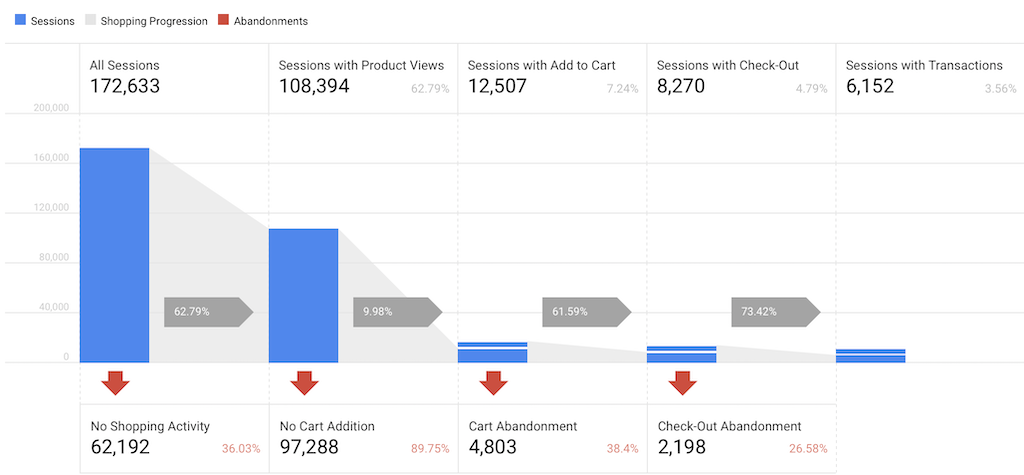
Google Analytics now gives increasingly better visualisations of where users drop off. Whether it’s checkout related or earlier, you’ll know.
Google Analytics provides the overview shown here by simply setting up enhanced e-commerce tracking on the website.
Once you have identified the individual steps that are causing issues, you can start to boil it down content wise.
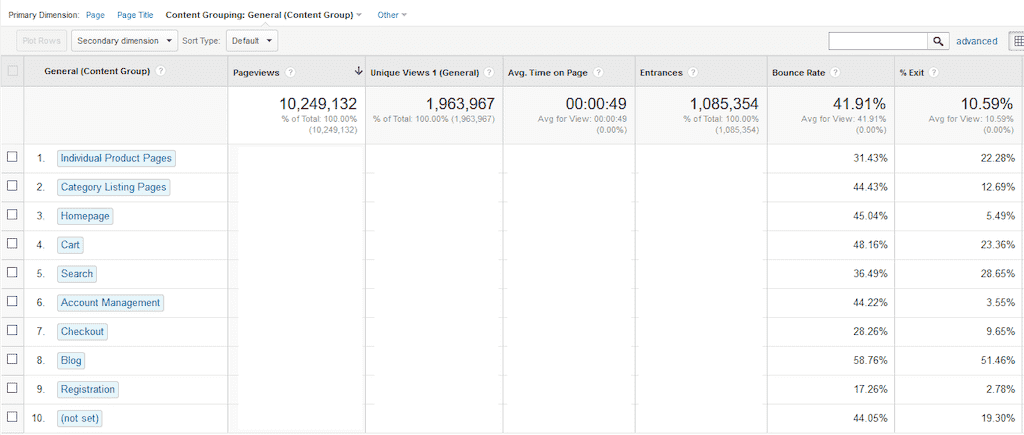
The real value value hack comes from analysing specific content groups and categories on your website.
4. Conversion Rate: Not Analysing Best Selling Products and Categories
80% of e-commerce sales comes from 20% of the listed product categories.
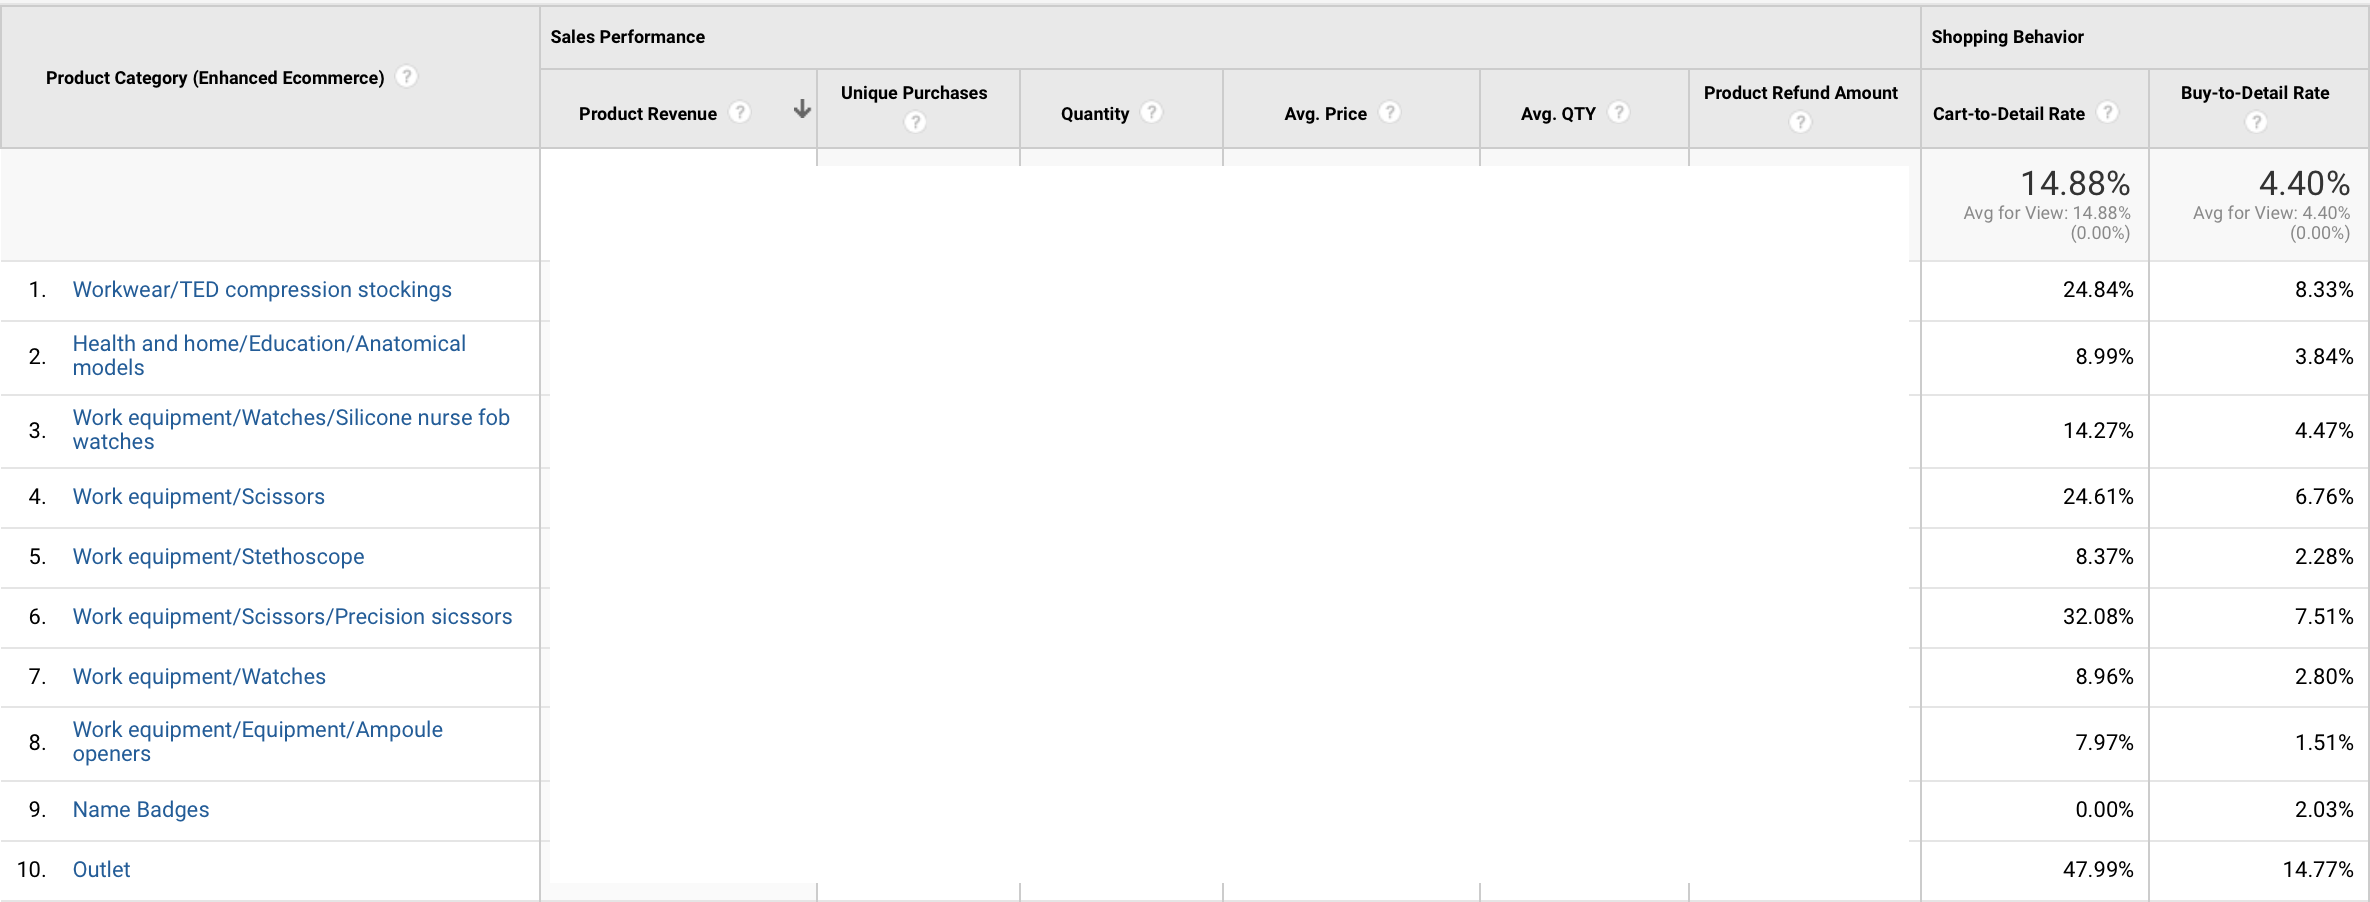
Consider segmenting your product line and see how your conversion rates change overnight. Here are a few metrics on which you could create different product segments with reference to their performance on your website:
- Rising stars that are doing well overall
- Outdated items that nobody wants anymore
- Products ordered together
- Products with maximum repeat purchases
The images are taken from Google Analytics content groupings and enhanced e-commerce product category segmentation. Notice how Cart-to-detail and buy-to-detail vary greatly from category to category.
5. Conversion Rate: Not understanding the big metrics behind conversion rates
If anything says something about user experience directly, it is bounce rates, exit pages and avg. duration on site.
If you lose them, you can’t convert them.
Still today, metrics that tell how good web pages are at keeping the attention of users are being neglected or at least not on the agenda that often.
- Bounce Rate is the percentage of people who leave after viewing a single page. The bounce rate differs depending on what searches and channels that brought the visit so a lot of companies are unsure about how to perceive this.
- Exit Rate is not bounce rate. It is the percentage of people who leave after viewing the page. It shows the last page that users view before they move on. A very high exit rate on a specific (product) page can be a red flag.
- Click through rate (CTR) is the number of people who click a link to your website. Often, high relevance also translates to higher conversion rates.
- Average Session Duration gives you a general idea of how long people are sticking around your site. Duration on site varies from site to site depending on product / Service complexity.
- Average Page Depth – Pages per Session – is an engagement metric that tells you how many pages a potential shopper visited before leaving.
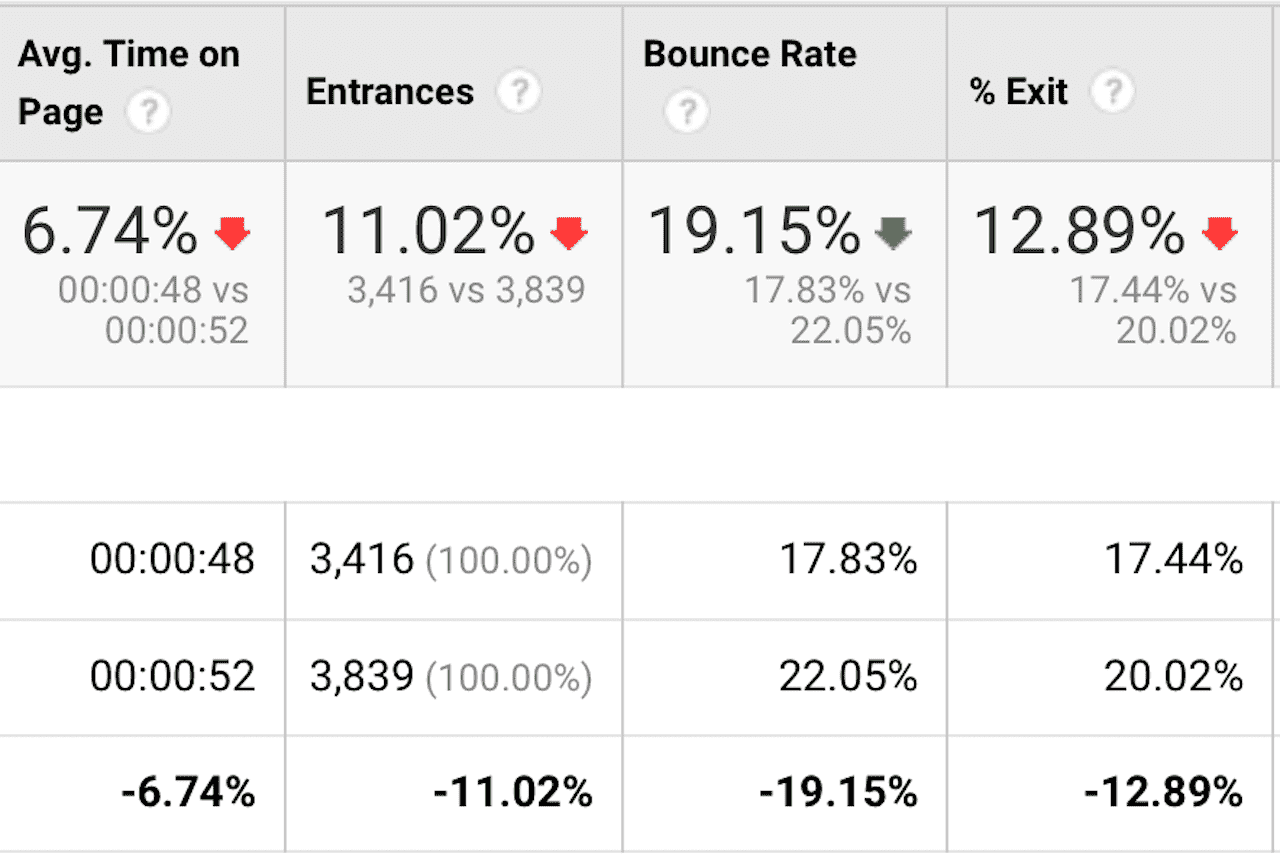
Check out the picture here on optimisation of a shop overview page. Bounce rates and exit pages are dropping while avg duration decrease by some seconds: Clear sign that the page is working better.

Your ultimate guide to conversion rate optimisation – getting started
Download our latest ebook which covers everything from attracting high quality leads to converting them across the purchase funnel.


0 Comments